Every few years, Lebanon Transit conducts Fixed Route rider surveys that get to the heart of local transit customers’ satisfaction with service, transit usage, and priorities for improvements. Conducted from October 8 to 19, 2025 both online and onboard buses, 314 riders completed the survey, making the results a representative snapshot of Fixed Route riders overall.
The results of the survey provide insights into key focus areas, including:
- Who is riding transit?
- How do riders use the system?
- What are riders most or least satisfied with?
- What should Lebanon Transit focus on to improve rider experience?
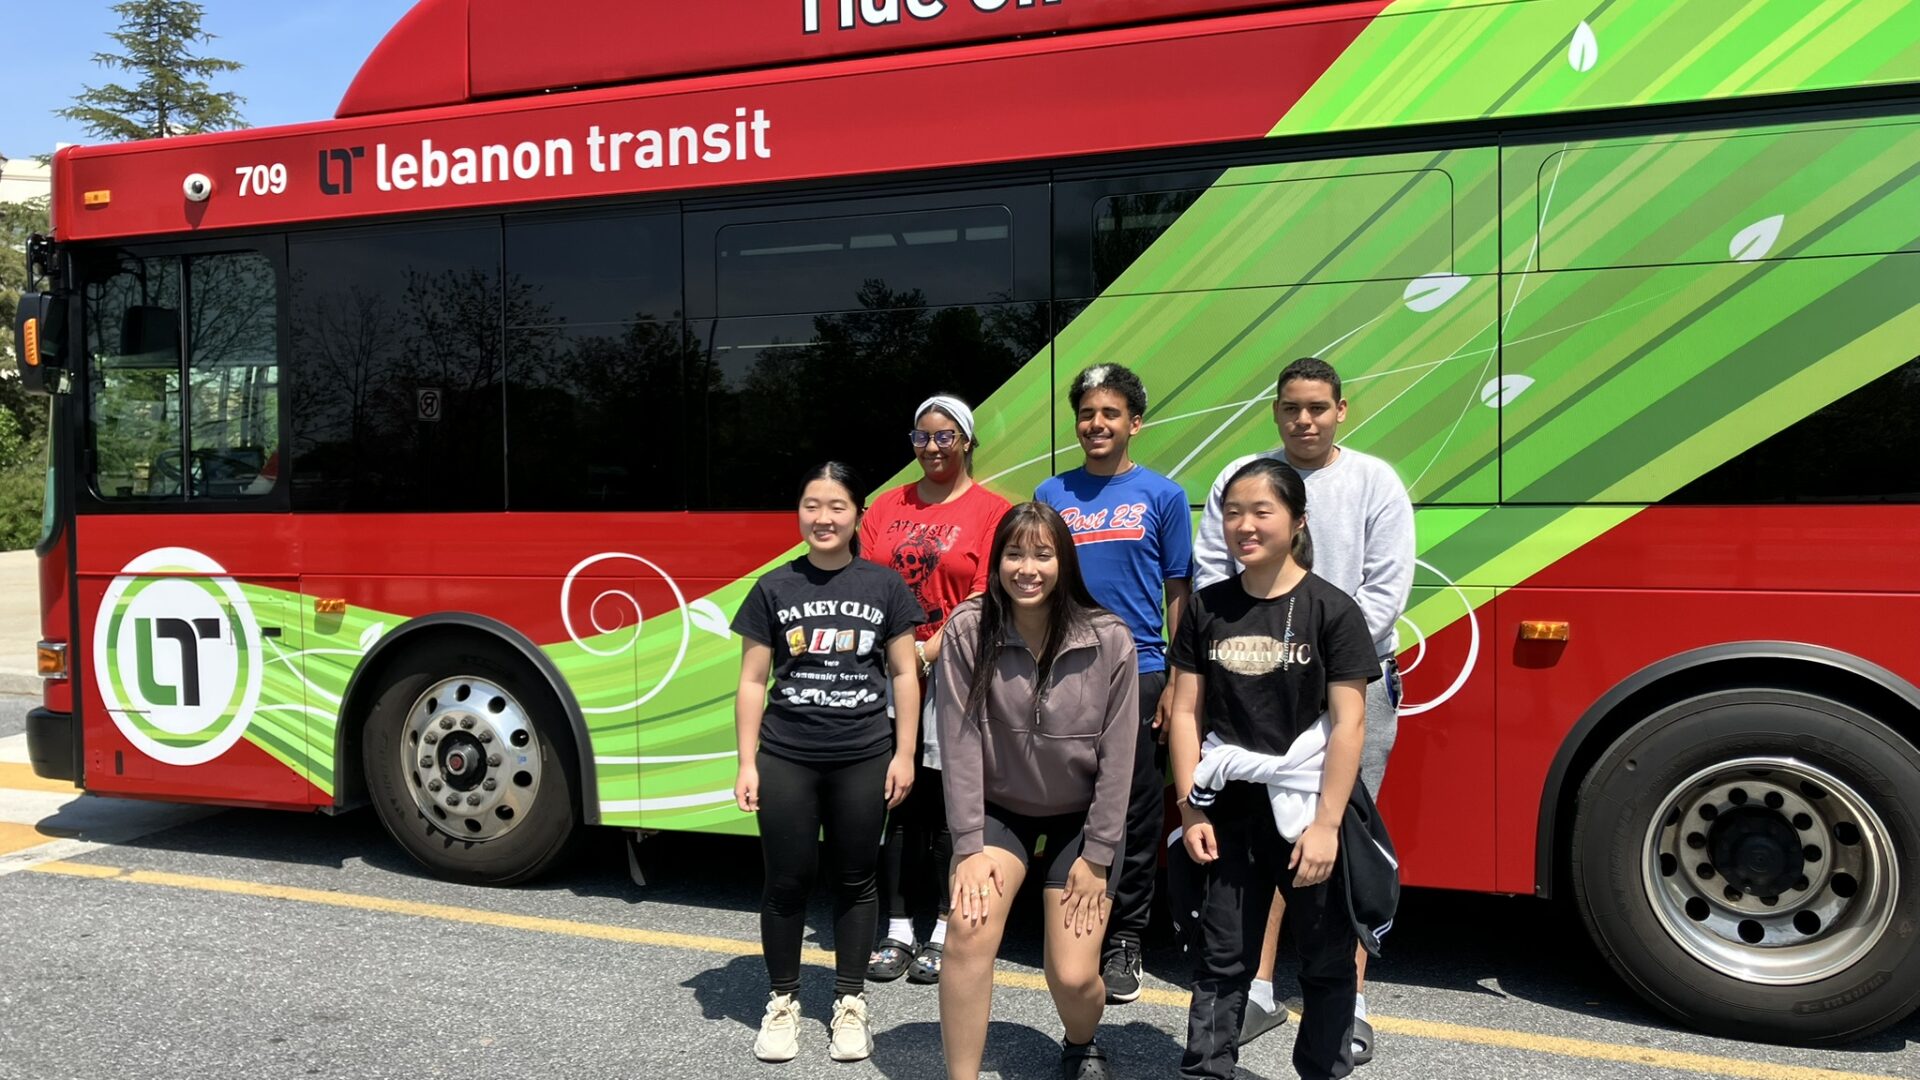
Who are our riders?
Transit in the Lebanon Valley serves a wide spectrum of people—all ages, all income levels, car owners, and the transit-dependent. The 2025 survey highlights how the diversity of the Lebanon community is reflected in bus ridership, thus cementing the idea that transit is for all. Transit is not a niche service—it is a backbone that supports riders across income levels, racial and ethnic groups, and employment situations.
Demographics
- More than 4 in 5 reside in or right around Lebanon City.
- 54% are female.
- More than half are employed, while more than ¼ are retired.
- 25% have a disability that impairs mobility, sight, or hearing.
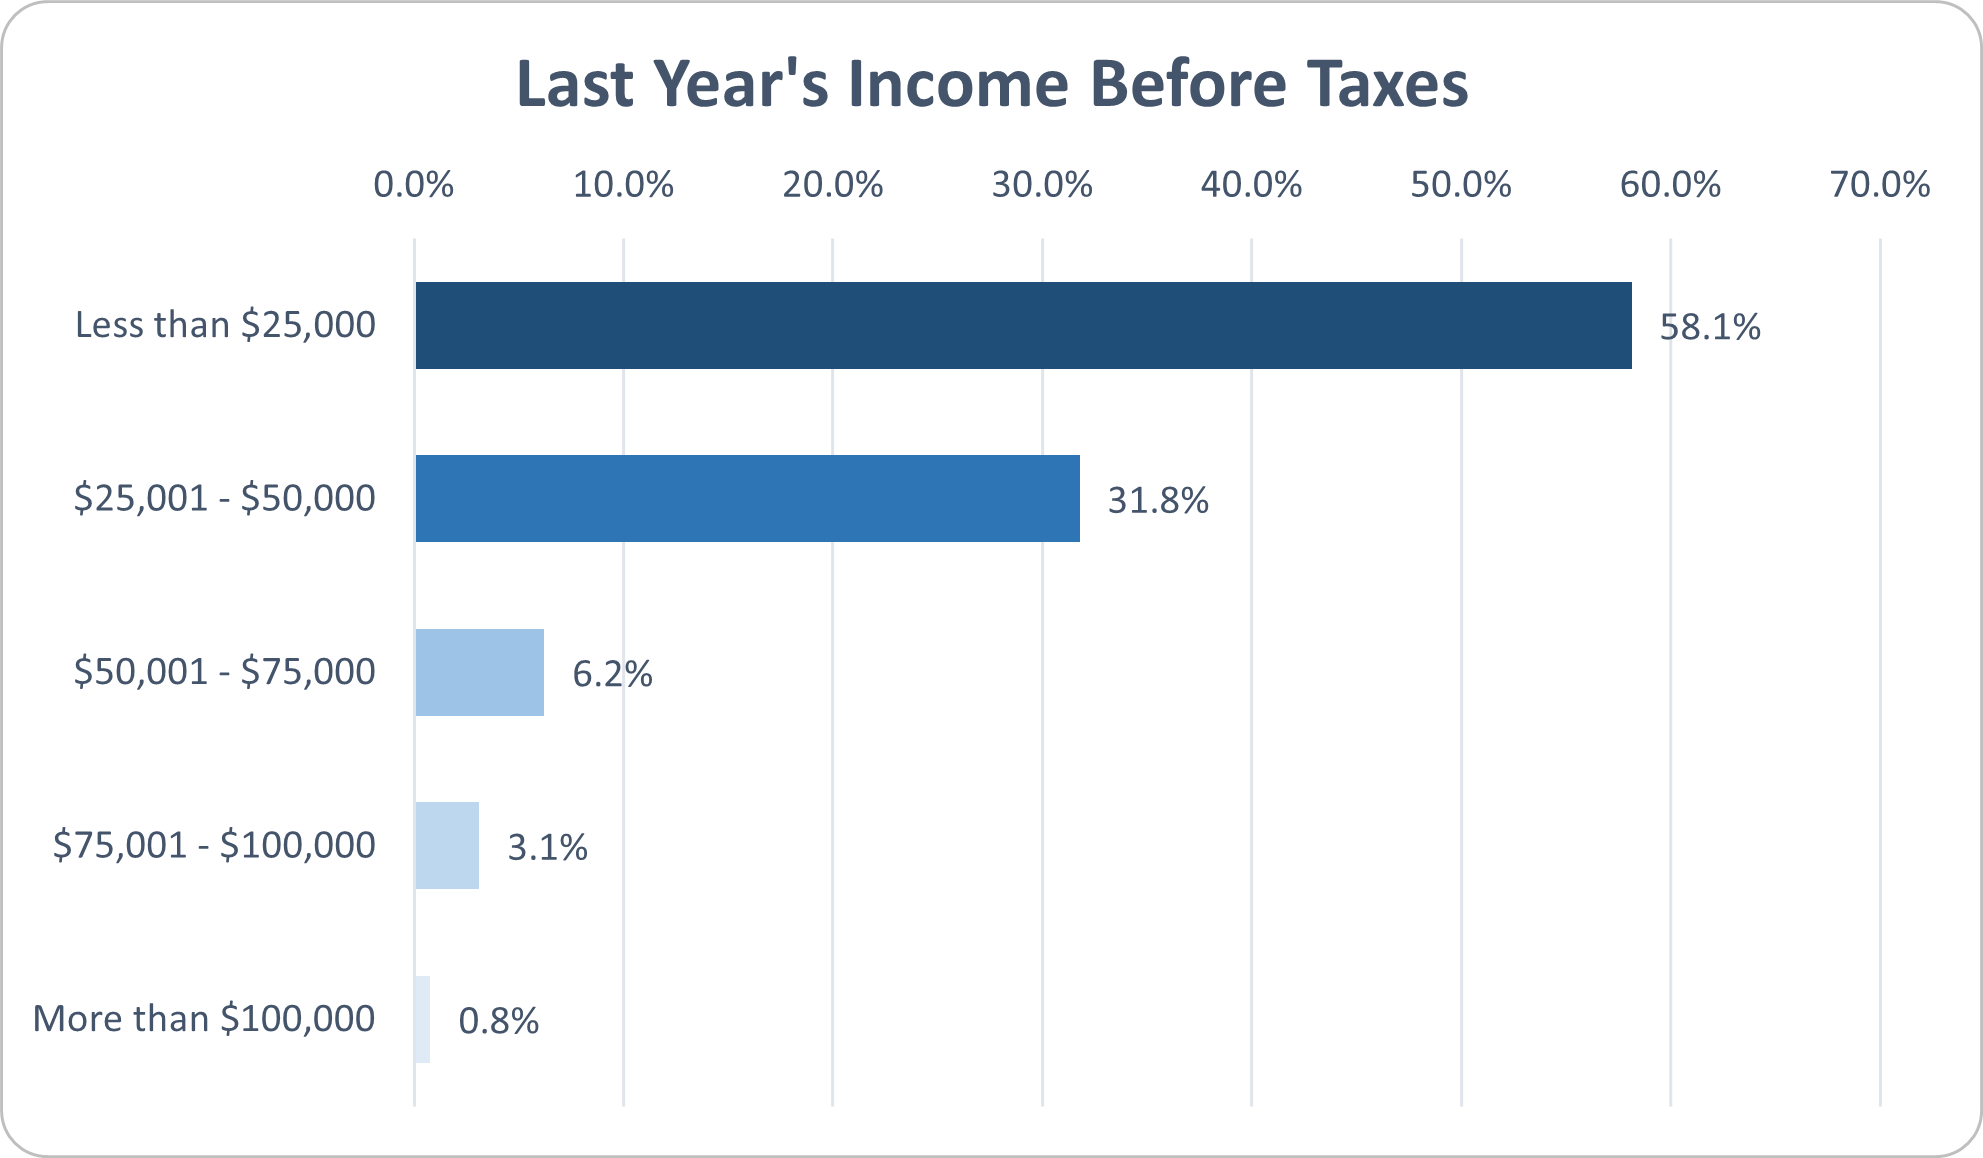
- 54% identify as White, 30% as Latino-Hispanic, and 14% as Black.
- 90% speak English, while nearly ¼ speak Spanish
Click to enlarge the image.
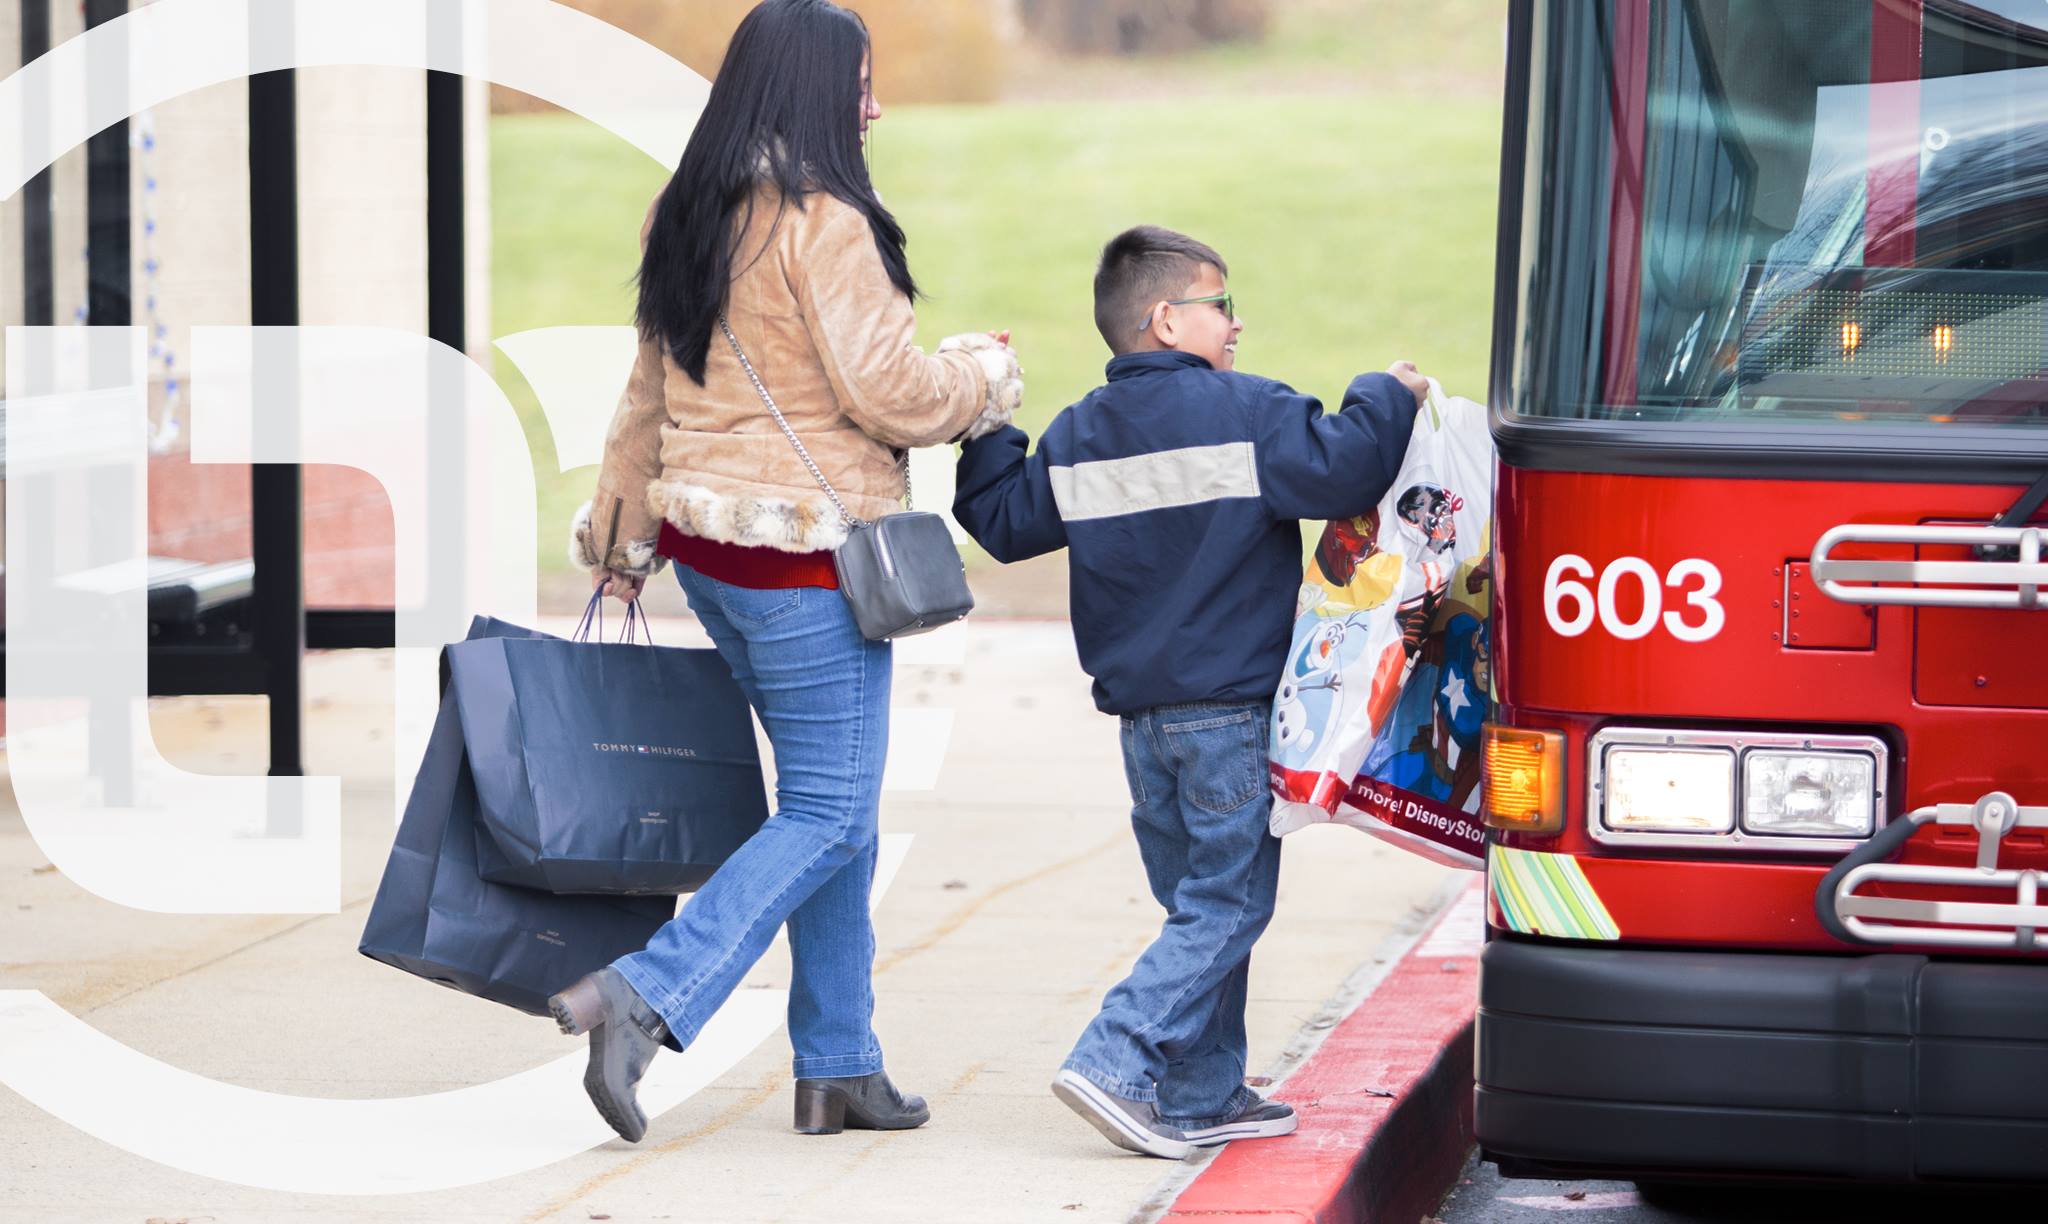
How do riders use the system?
The survey also shows how people rely on Lebanon Transit, revealing patterns of use. It is notable that nearly 60% of riders indicate they utilize Fixed Route bus service because they have no other transportation options. Nearly 4 in 10 responded they do not drive. Other prominent factors riders considered in their decisions to ride transit included the convenience (28%) and costs (22%).
Usage
- Shopping is the primary reason riders utilize the Fixed Route system (55%), while getting to and from work is a very close second (53%).
- Approximately one-third of riders use the bus to get to medical and dental appointments.
- Social and recreational activities are the reason 16% of riders use the bus.
In addition to these results, about half of riders are heavy users of the Fixed Route system, traveling by bus at least five days a week with another third traveling 2 to 4 days each week.
Taken together, these results make one thing clear: transit is indispensable for thousands of riders in the Lebanon Valley. Local residents ride public transit not because of concerns about environment or parking, but as a practical and cost-effective means to get to work, school, healthcare, and the necessities of daily life.
What are riders most or least satisfied with?
The 2025 survey results show that an overwhelming majority of riders – 98% – are satisfied or very satisfied overall with Lebanon Transit’s Fixed Route system, but the findings also make clear that there is room for improvement, especially in areas like service frequency and the tools riders use to navigate the system (website, bus schedules, bus tracker app).
Riders rated twenty different performance measures on a scale of 1 to 5 (5 being “very satisfied”). The average score for each measure was then calculated. Additionally, the percentage of unfavorable ratings was figured for each. Unfavorable ratings corresponded to the number of respondents who rated the performance measure “Dissatisfied” or “Very Dissatisfied”. The percentage of unfavorable ratings was then determined by calculating the ratio of respondents who rated a measure unfavorably to the number of respondents who actually rated the measure at all.
High Satisfaction
- Riders are most satisfied with bus operators, finding them safe, competent, courteous, friendly, and helpful.
- Riders also generally feel safe on board buses and at bus stops.
- Bus cleanliness and the availability of seats also rank high in satisfaction.
While every performance measure received an average score above 4, indicating overall satisfaction, a few measures still stand out as potential areas for improvement.
Low Satisfaction
- The frequency of weekend service is the performance measure riders are most dissatisfied with.
- Riders also indicate the Lebanon Transit website is difficult to navigate, bus schedules are not available enough and are hard to read, and the myStop Moble app / real-time bus tracker software is challenging.
Thank you to the riders who filled out a survey to help us improve our Fixed Route service! Checkout a downloadable version of the survey results HERE. And be sure to keep checking our news page and following us on social media to learn all Lebanon Transit is doing to better serve the Lebanon Valley.